
插件目录 / Knowledge / dsh-context
dsh-context
已验证 · 实测可装 bowenliang123
功能简介
DSH上下文洞察面板插件:网页UI显示模型上下文窗口构成
推荐 — 实测可用且热门
DSH上下文洞察面板插件:网页UI显示模型上下文窗口构成 实测能干净安装、正常启动。1038+ stars,社区认可度高,是低风险选择。
「已验证」表示我们的自动化 CI 在干净 profile 里实际执行了 dsh plugin add 并启动成功——仅此而已。功能描述与版本兼容性均为作者声明。这不是安全审计,也不代表对第三方代码的背书。
README
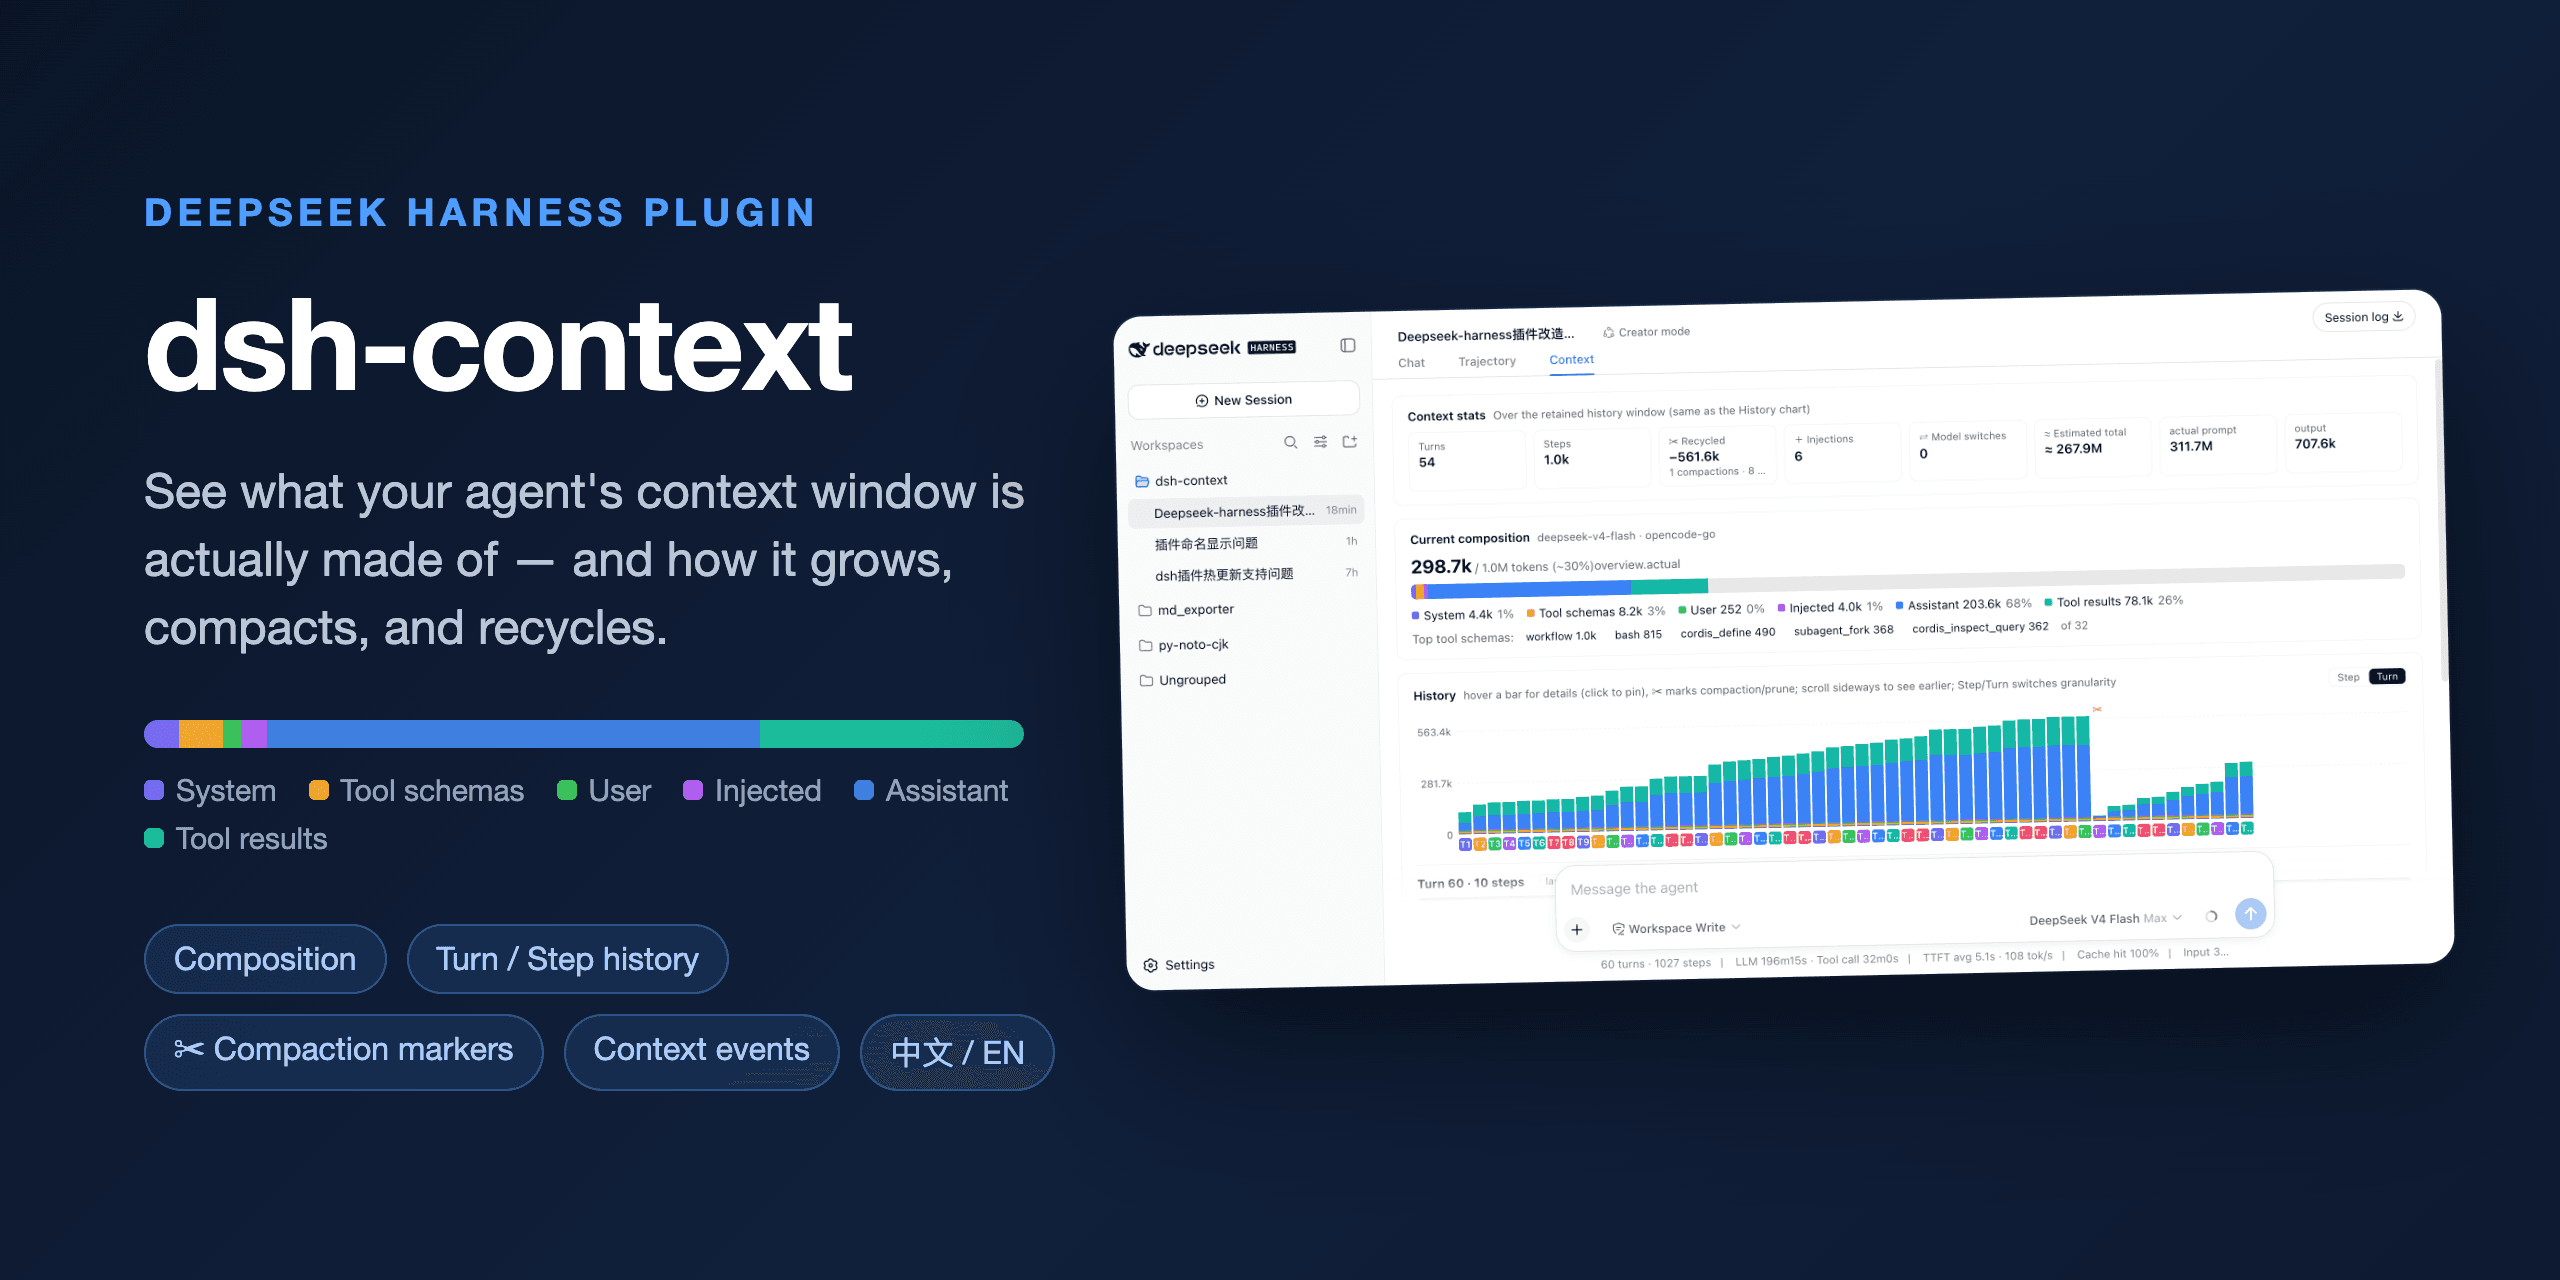
dsh-context


The best DeepSeek Harness plugin for Agent's context insights and management.
dsh-context provides full context lifecycle management features.
- Context tab — an UI context dashboard for DeepSeek Harness’s context stats, composition, history, events, and messages.
/contextcommand — the slash command shows the context model for current context composition and recent context evolution.
Install / Update
To Install from any DeepSeek Harness installation:
dsh plugin --profile web add dsh-context
Or to update the dsh-context plugin:
dsh plugin --profile web update dsh-context@latest
Then start the web UI with dsh web. No build step, no restart.
Use it
Context tab
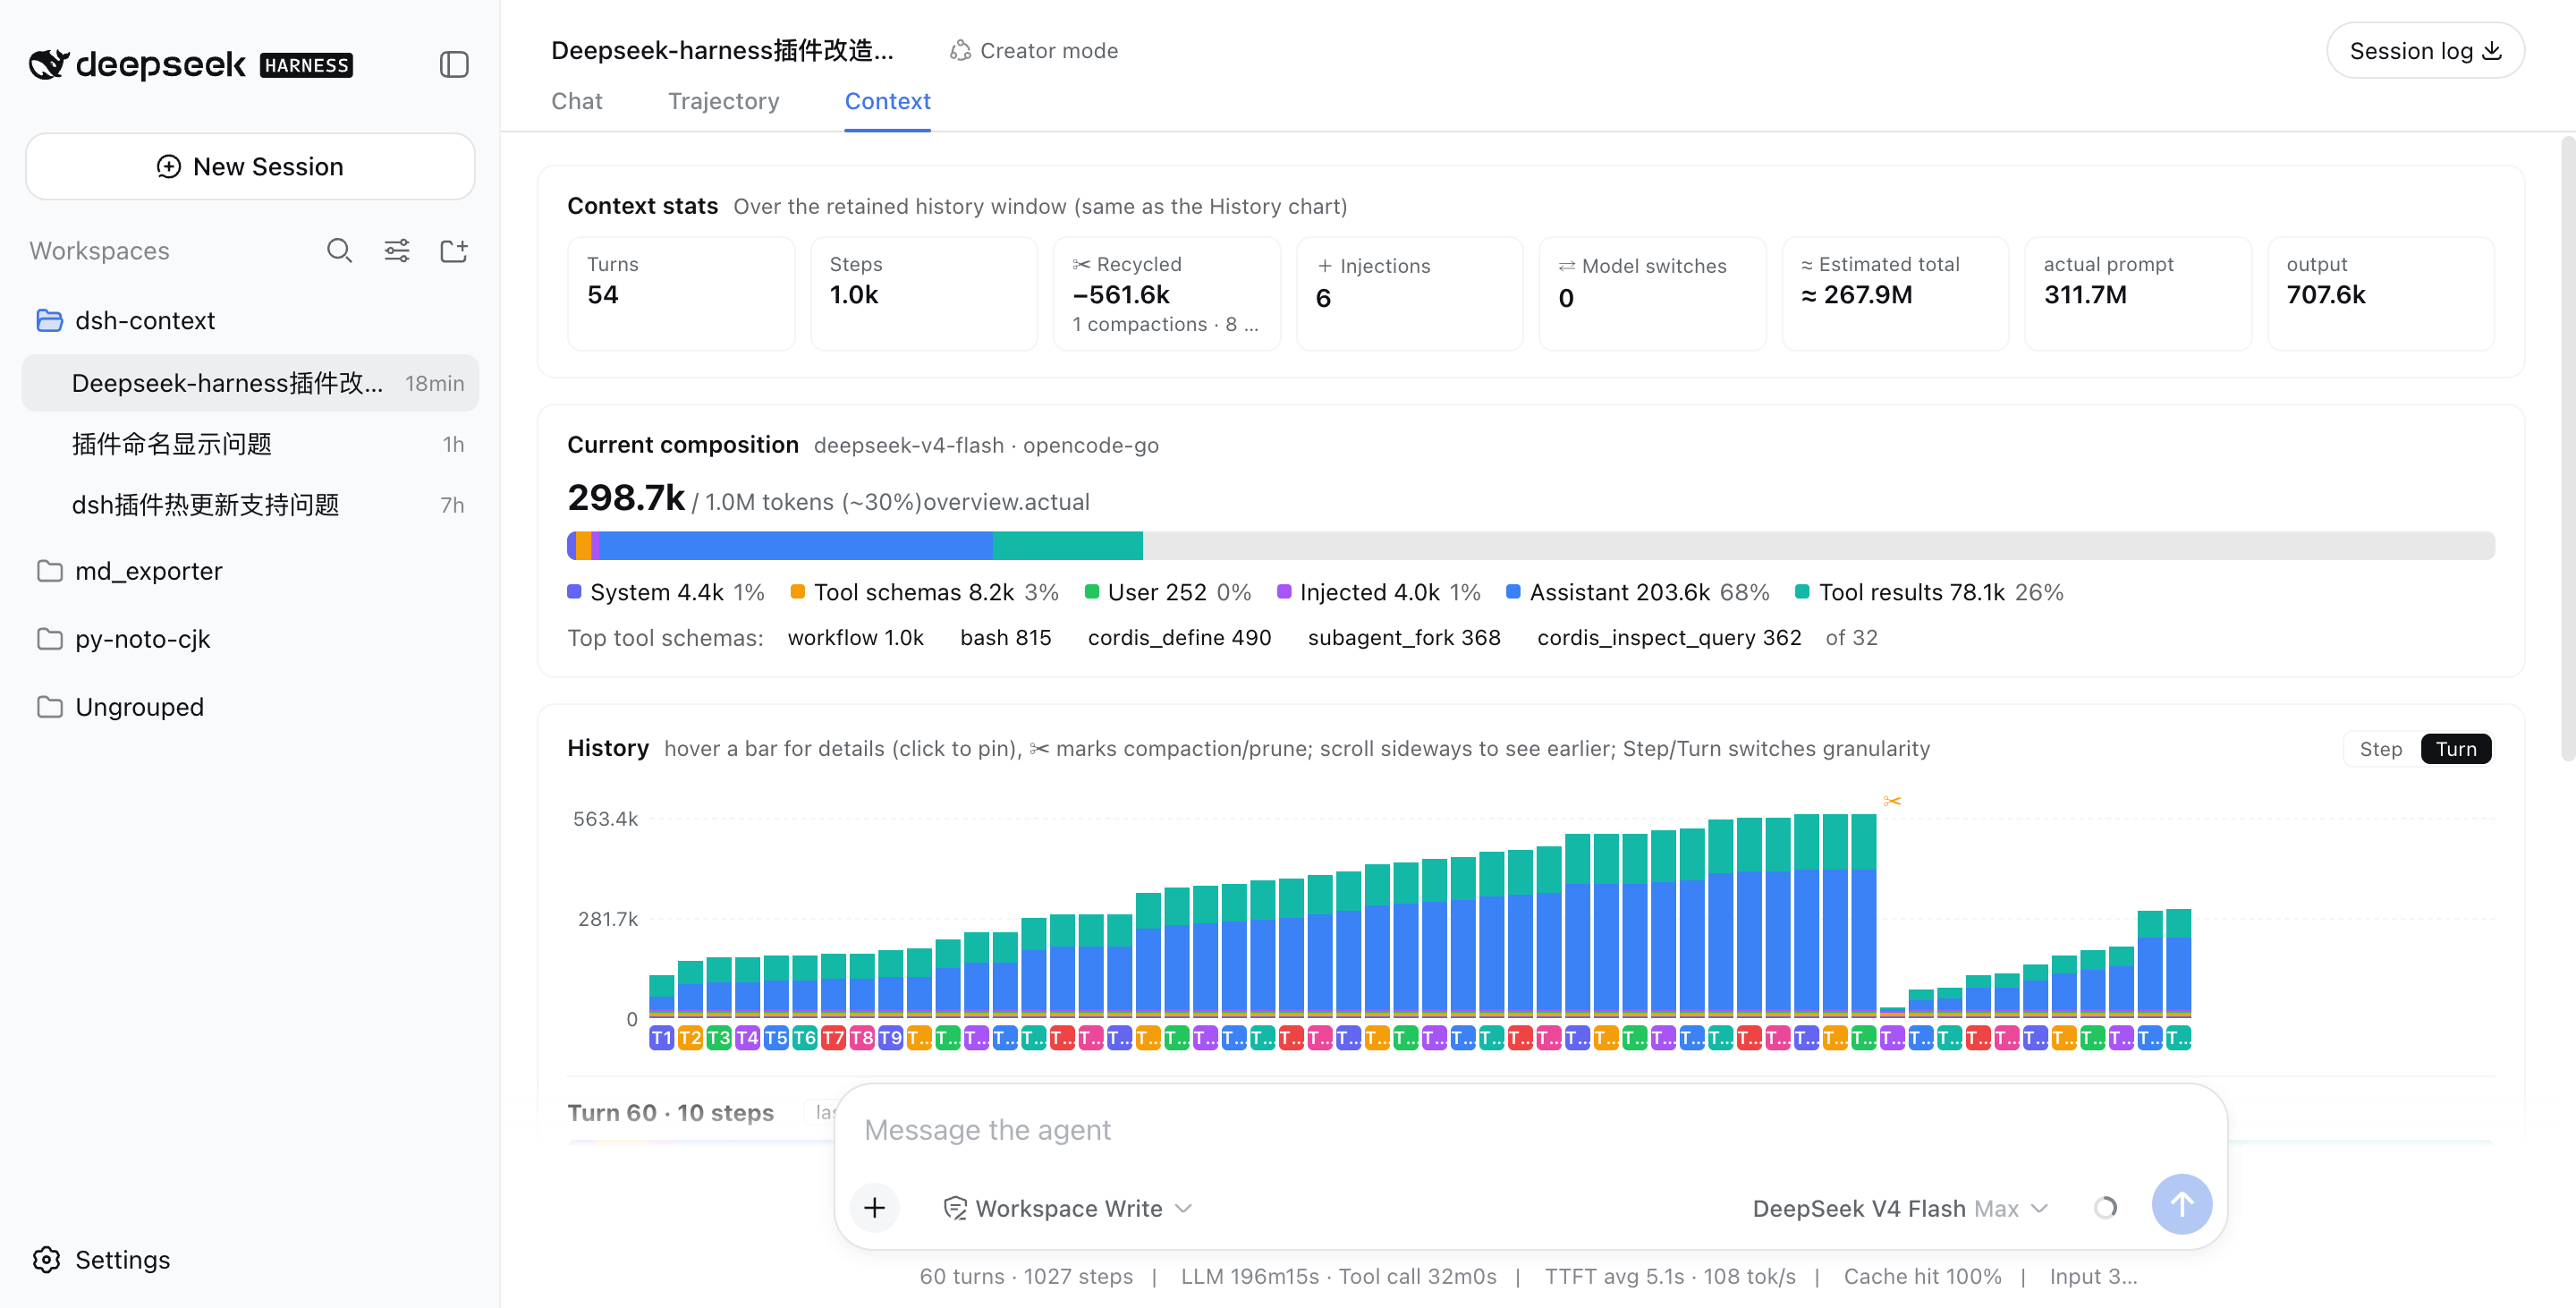
Open any session and click the Context / 上下文 tab:
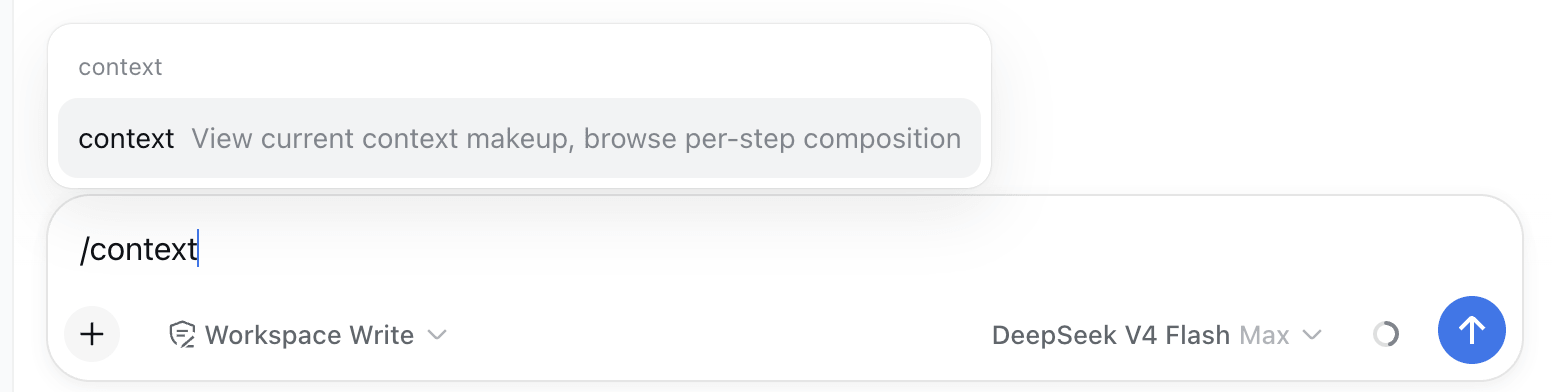
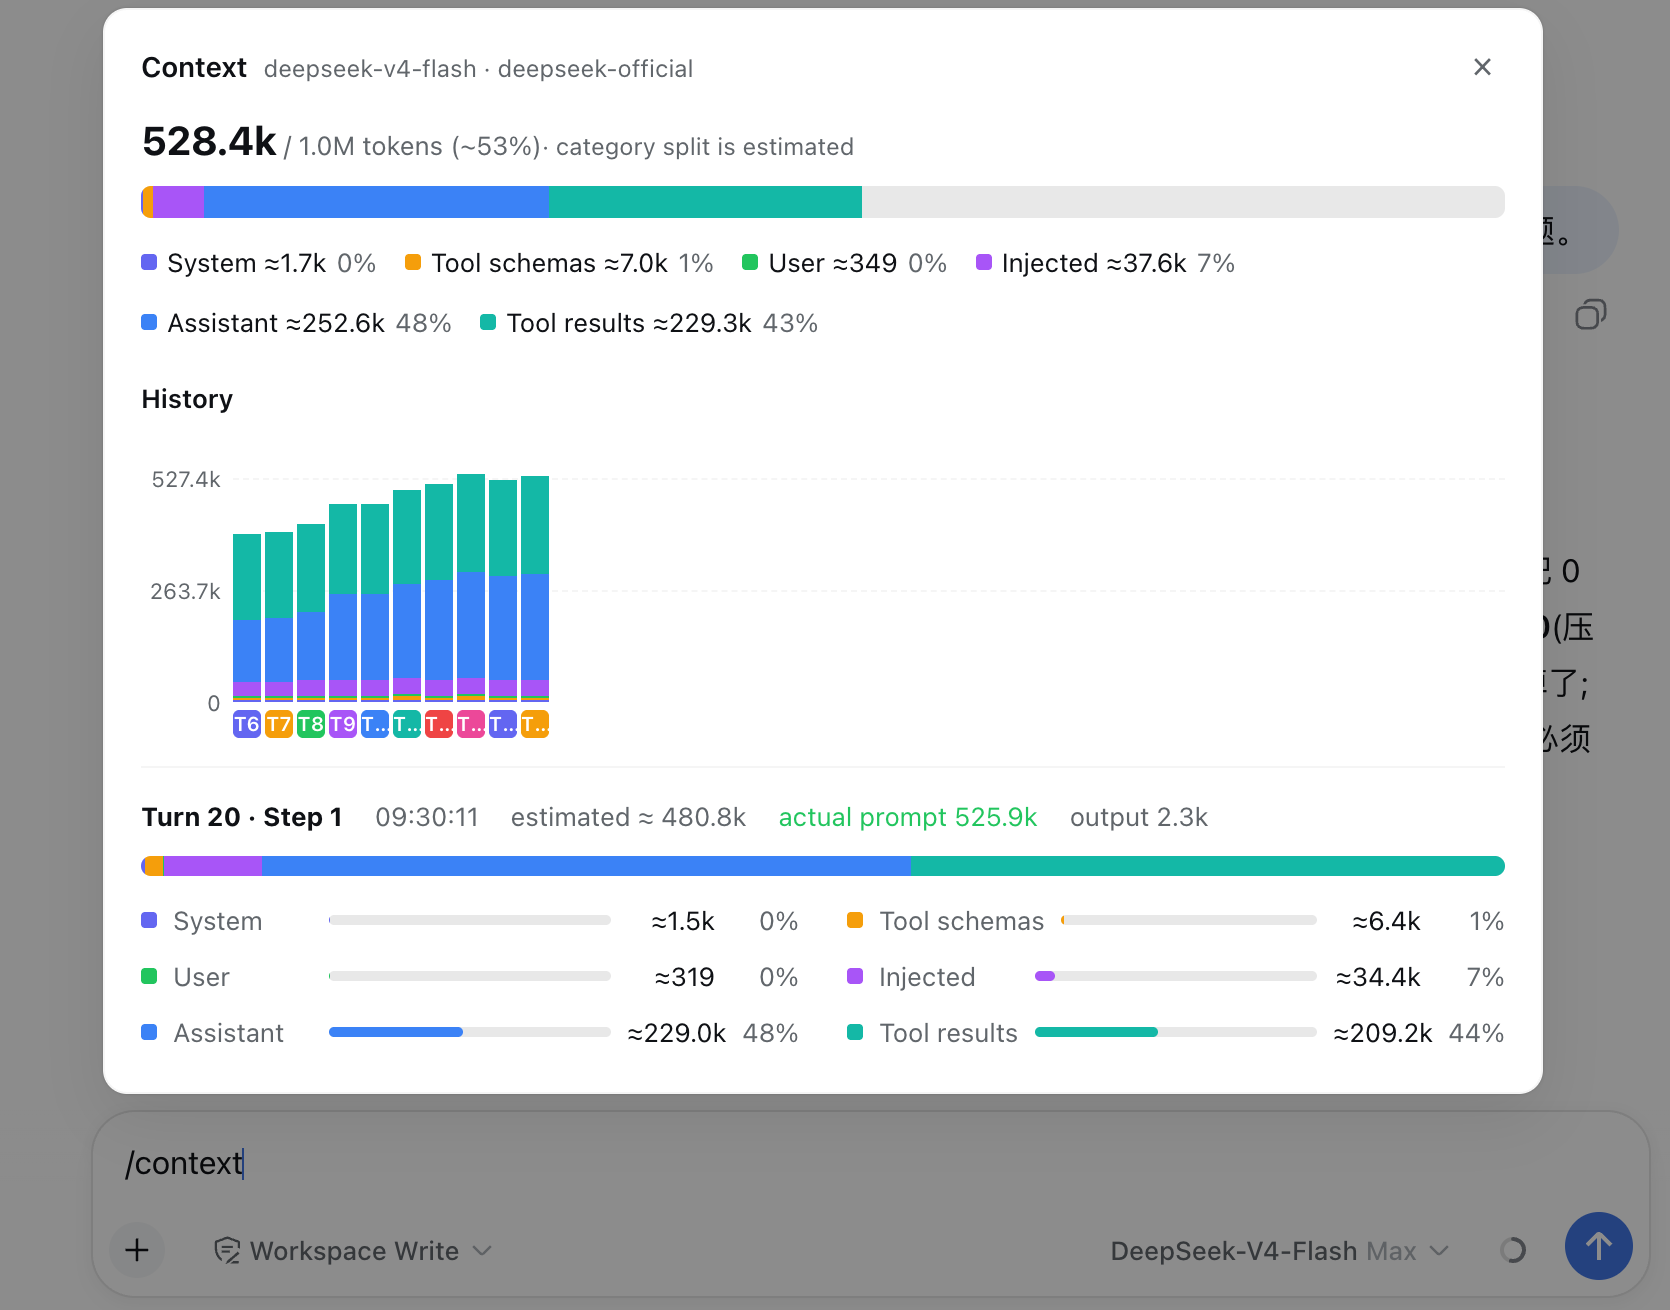
⌨️ /context command — In-session Context Insight modal
Type /context (or pick it from the / menu) and press Enter: a centered dialog shows the Current Composition card and the Context browser — the same composition bar, legend, and per-step browsing as the tab, so you can inspect what any request was assembled from without leaving the chat.
⚙️ Settings — per-user preferences
In Settings → Plugins → Plugin configuration, the Context / 上下文 card holds this plugin's per-user preferences — the default trend granularity (Step/Turn) and the default trend mode (Total/Delta) the Context tab opens with. In-chart toggling stays per-view and never overwrites the stored preference. The card appears only when the Host half is installed and the settings document is writable (a remote browser keeps settings process-local and shows no card).
What you'll see
📊 Context stats — the session at a glance
Turns, steps, how many injections, compactions, and prunes have happened.
🧱 Current composition — what's in the window right now
A six-color stacked bar scaled against the model's full context window (the gray track is your remaining headroom): system prompt, tool schemas, your messages, injected context, assistant replies, and tool results — plus the top-5 most expensive tool schemas. When a conversation starts degrading, this is where you find out which part ate the budget.
The headline occupancy and the composition counts read the same official token-meter projections the chat composer's context ring reads (contextPressure / contextBreakdown), so the legend's ≈ figures and proportions match the ring's click-open panel exactly; the message bucket is subdivided into the four surface categories by the fold's per-category ratios.
📈 History — watch the window grow (and get compacted)
One stacked bar per model request, finer than per-message. Toggle between Turn and Step granularity and between Total (each request's cumulative size) and Delta (each request's incremental change) views, scroll sideways through the session, hover any bar for a quick tooltip, and click to pin the full breakdown — including provider-reported actual prompt/output tokens next to the estimate. Hovering a bar also drives the Context browser beside it — the browser previews that step's assembled context in real time as you scrub across the history. ✂ marks where compaction or pruning happened — watch the bars drop:
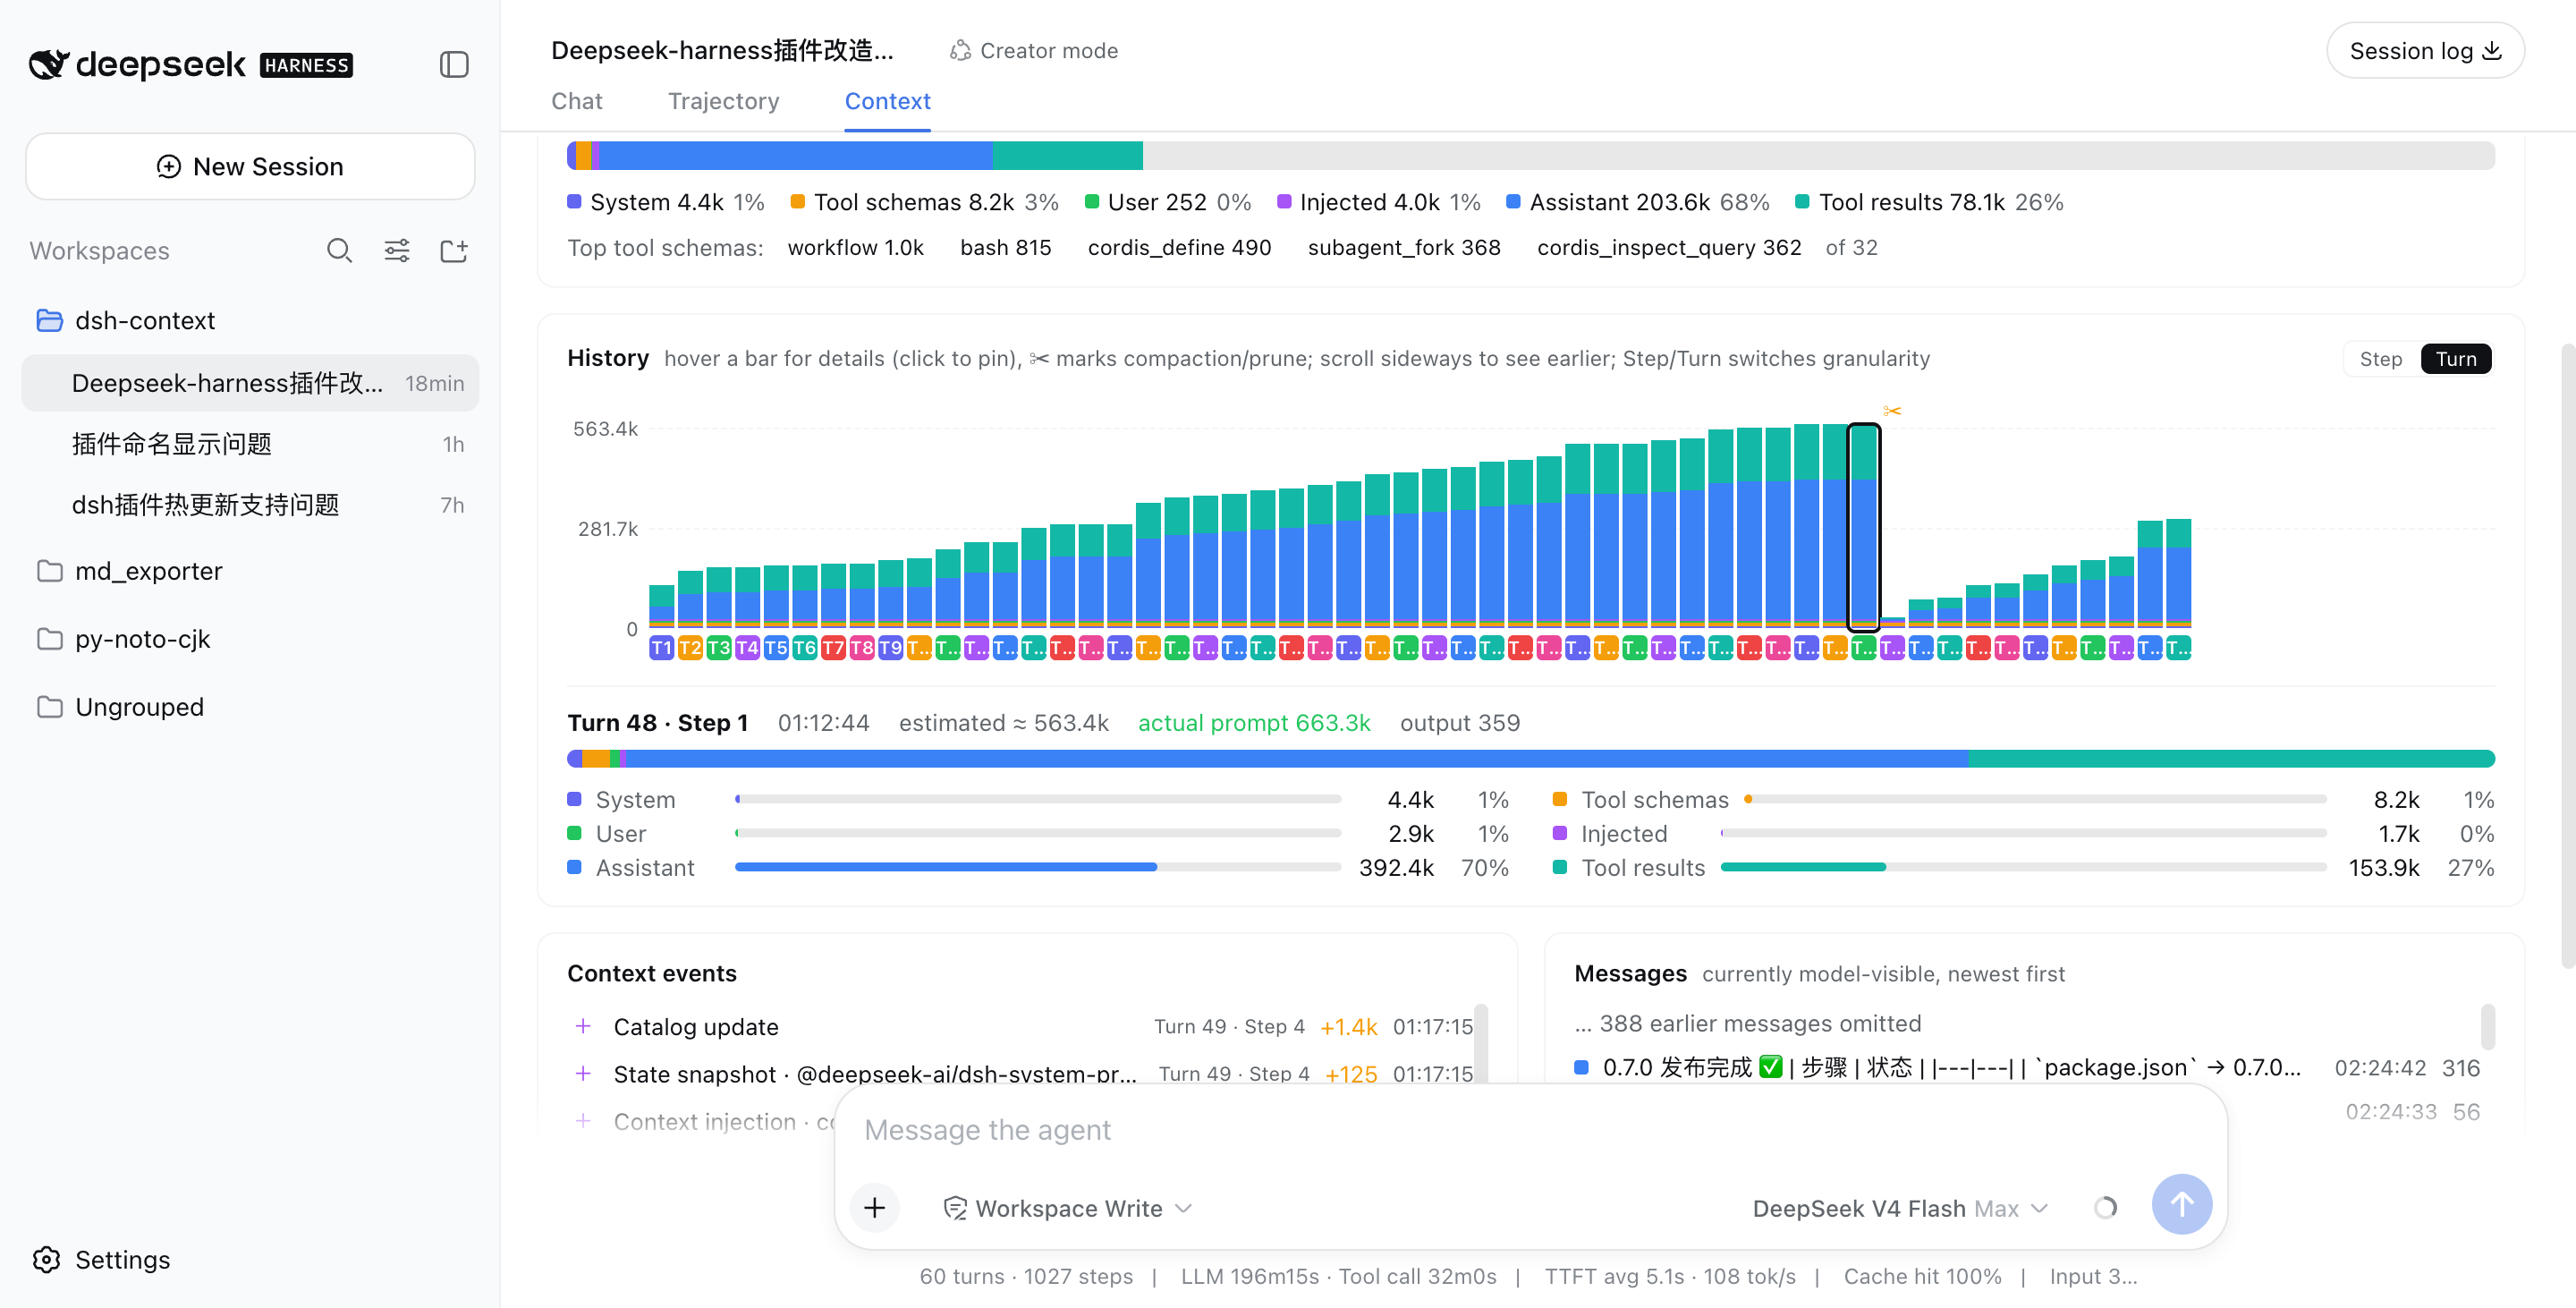
Above: a real session that grew to ~563k tokens across 48 turns, then compaction (✂) recycled −535.5k in one step, and the conversation continued from a fresh, small window.
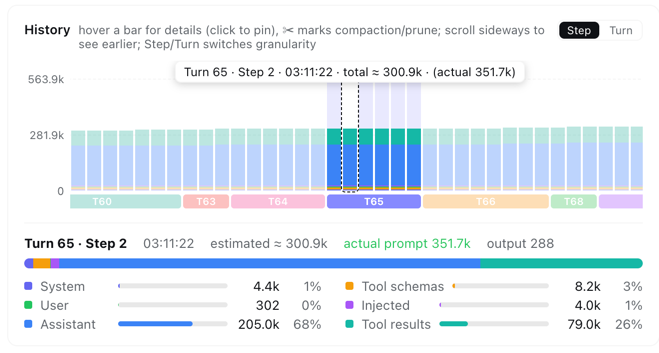
In Step granularity, hovering any bar shows that single step's context info instantly — its turn/step, timestamp, and estimated vs. provider-reported token counts:
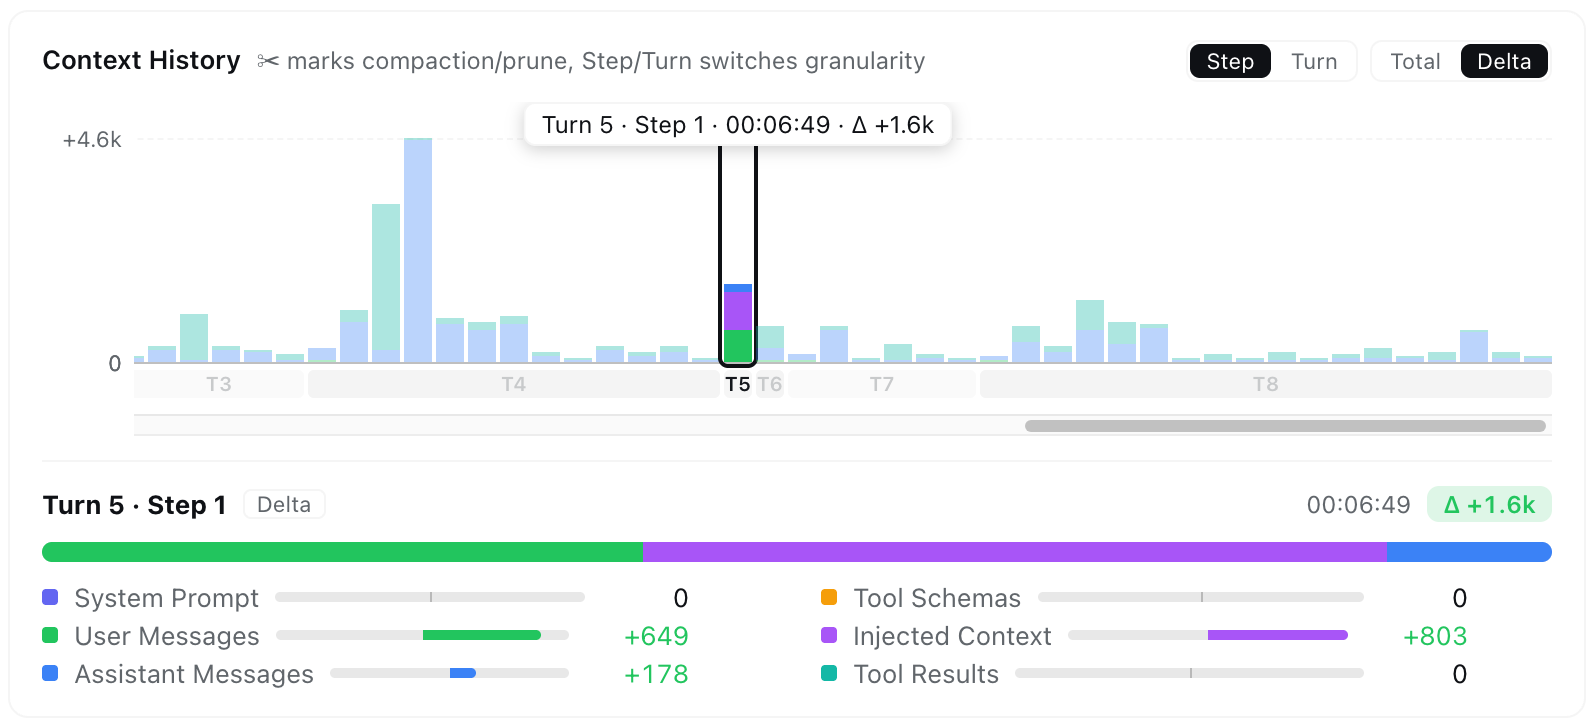
Switch the chart from Total to Delta and each bar becomes the change that request made to the window instead of its cumulative size: diverging stacks pile up from the solid zero baseline when the window grew and hang below it when it shrank, tooltips read Δ ±Nk, and the pinned detail card re-prices every category as a signed delta — so you can tell exactly which part of a request added (or reclaimed) tokens. Below, Turn 5's first step grew the window by +1.6k: injected context +803, the user message +649, the assistant reply +178 — and nothing else moved:
⚡ Context events — when and why the window changed
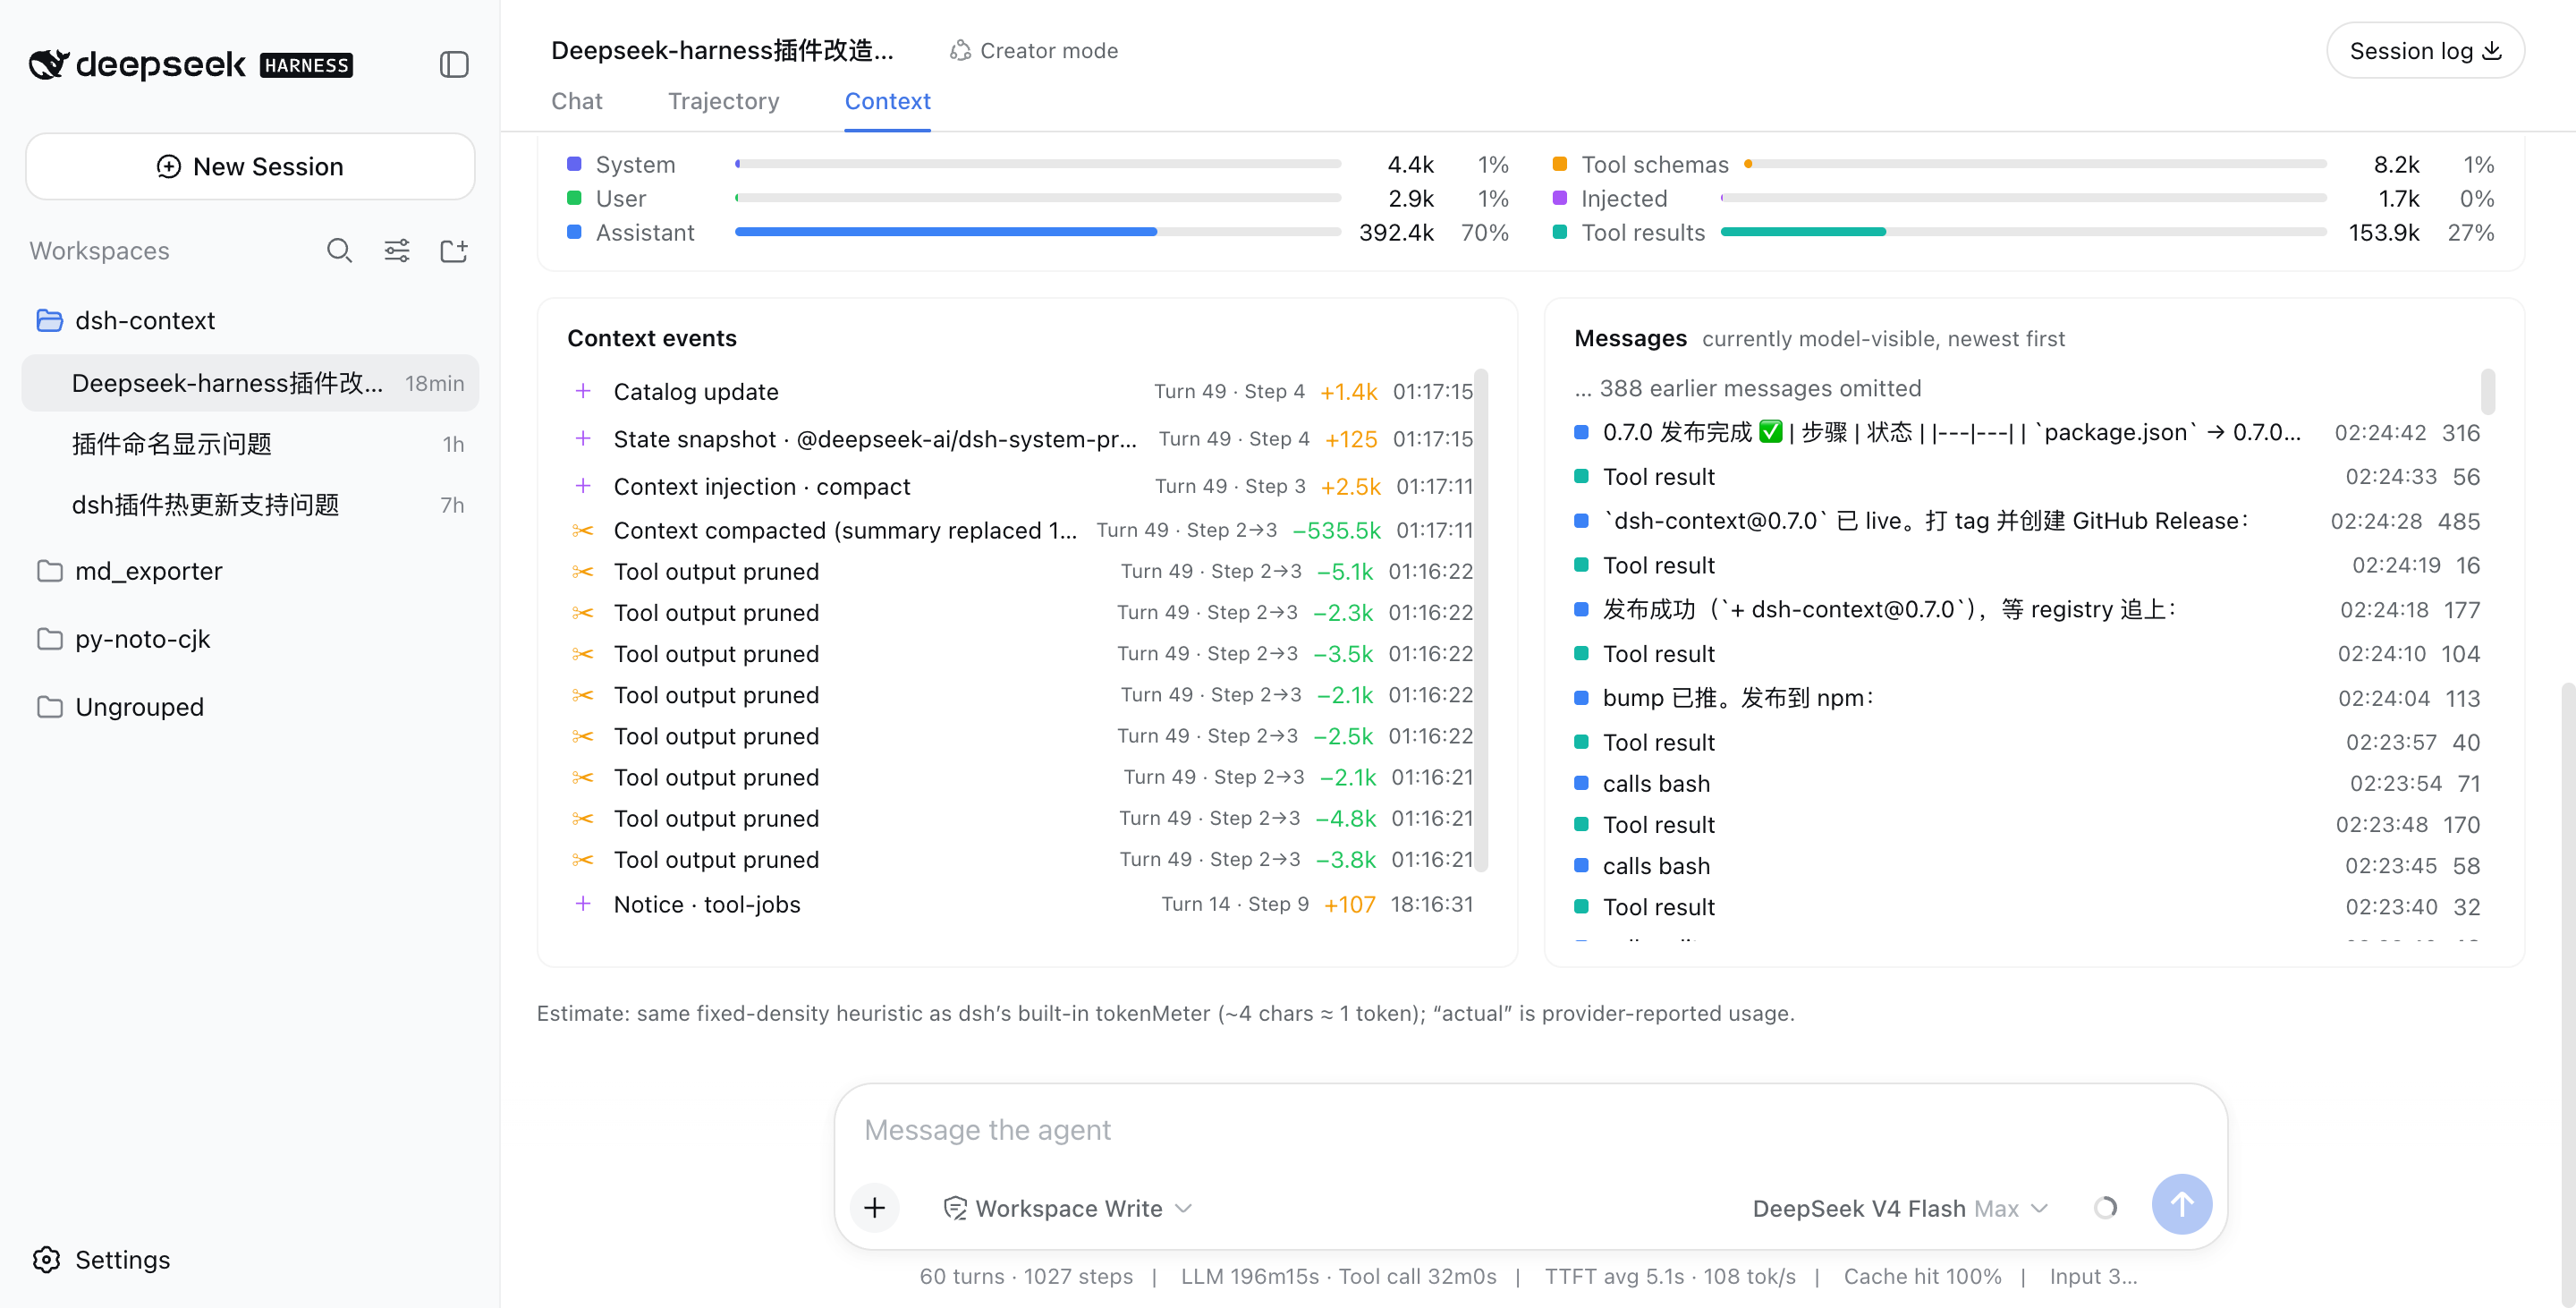
Every compaction, tool-output prune, skill or plugin context injection, model switch, and plan-mode toggle — each labeled with its producer source (instruction file paths, plugin id, skill name), its token delta (compactions/prunes show the net reclaimed amount, matching the chart's drop), turn/step attribution, and timestamp. Filter by category (Inject / Compact / Prune / Switch / Mode) to see exactly when each kind of event happened and its impact — e.g. when a skill was injected, when instructions were added, or how much a compaction reclaimed:
💬 Messages — the currently model-visible surface
The exact message list the model sees right now, newest first, with a per-message token cost.
🧭 Context browser — open the box of any request
Pick Live (next request) or any retained step from the picker, and browse what that request was actually assembled from:
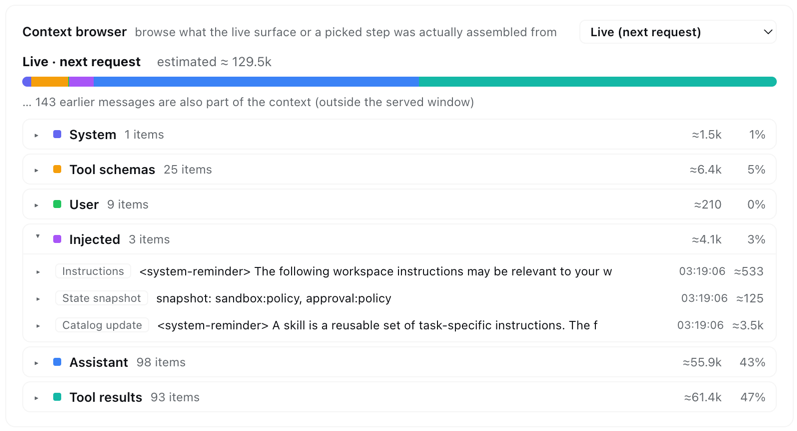
Six collapsible category sections (system prompt, tool schemas, user messages, injected context, assistant replies, tool results) expand into one row per element — each with its token price — and every element expands again into its actual content: the full system prompt, each tool's description and JSON schema, message text, reasoning, tool-call arguments, and tool outputs.
- Linked with the history chart — hover any bar in the History card and the browser previews that step instantly; leave the chart and it returns to your own pick. Keep a category open while scrubbing to compare one category across steps.
- Honest about coverage — steps before a compaction are reconstructed from the removed-message archive, and the card says so when a step's makeup is only approximate. Elements older than the loaded chat window page older history in automatically when you expand them, and live injections (AGENTS.md, session-start context, …) are always listed — never a token sum without its items.
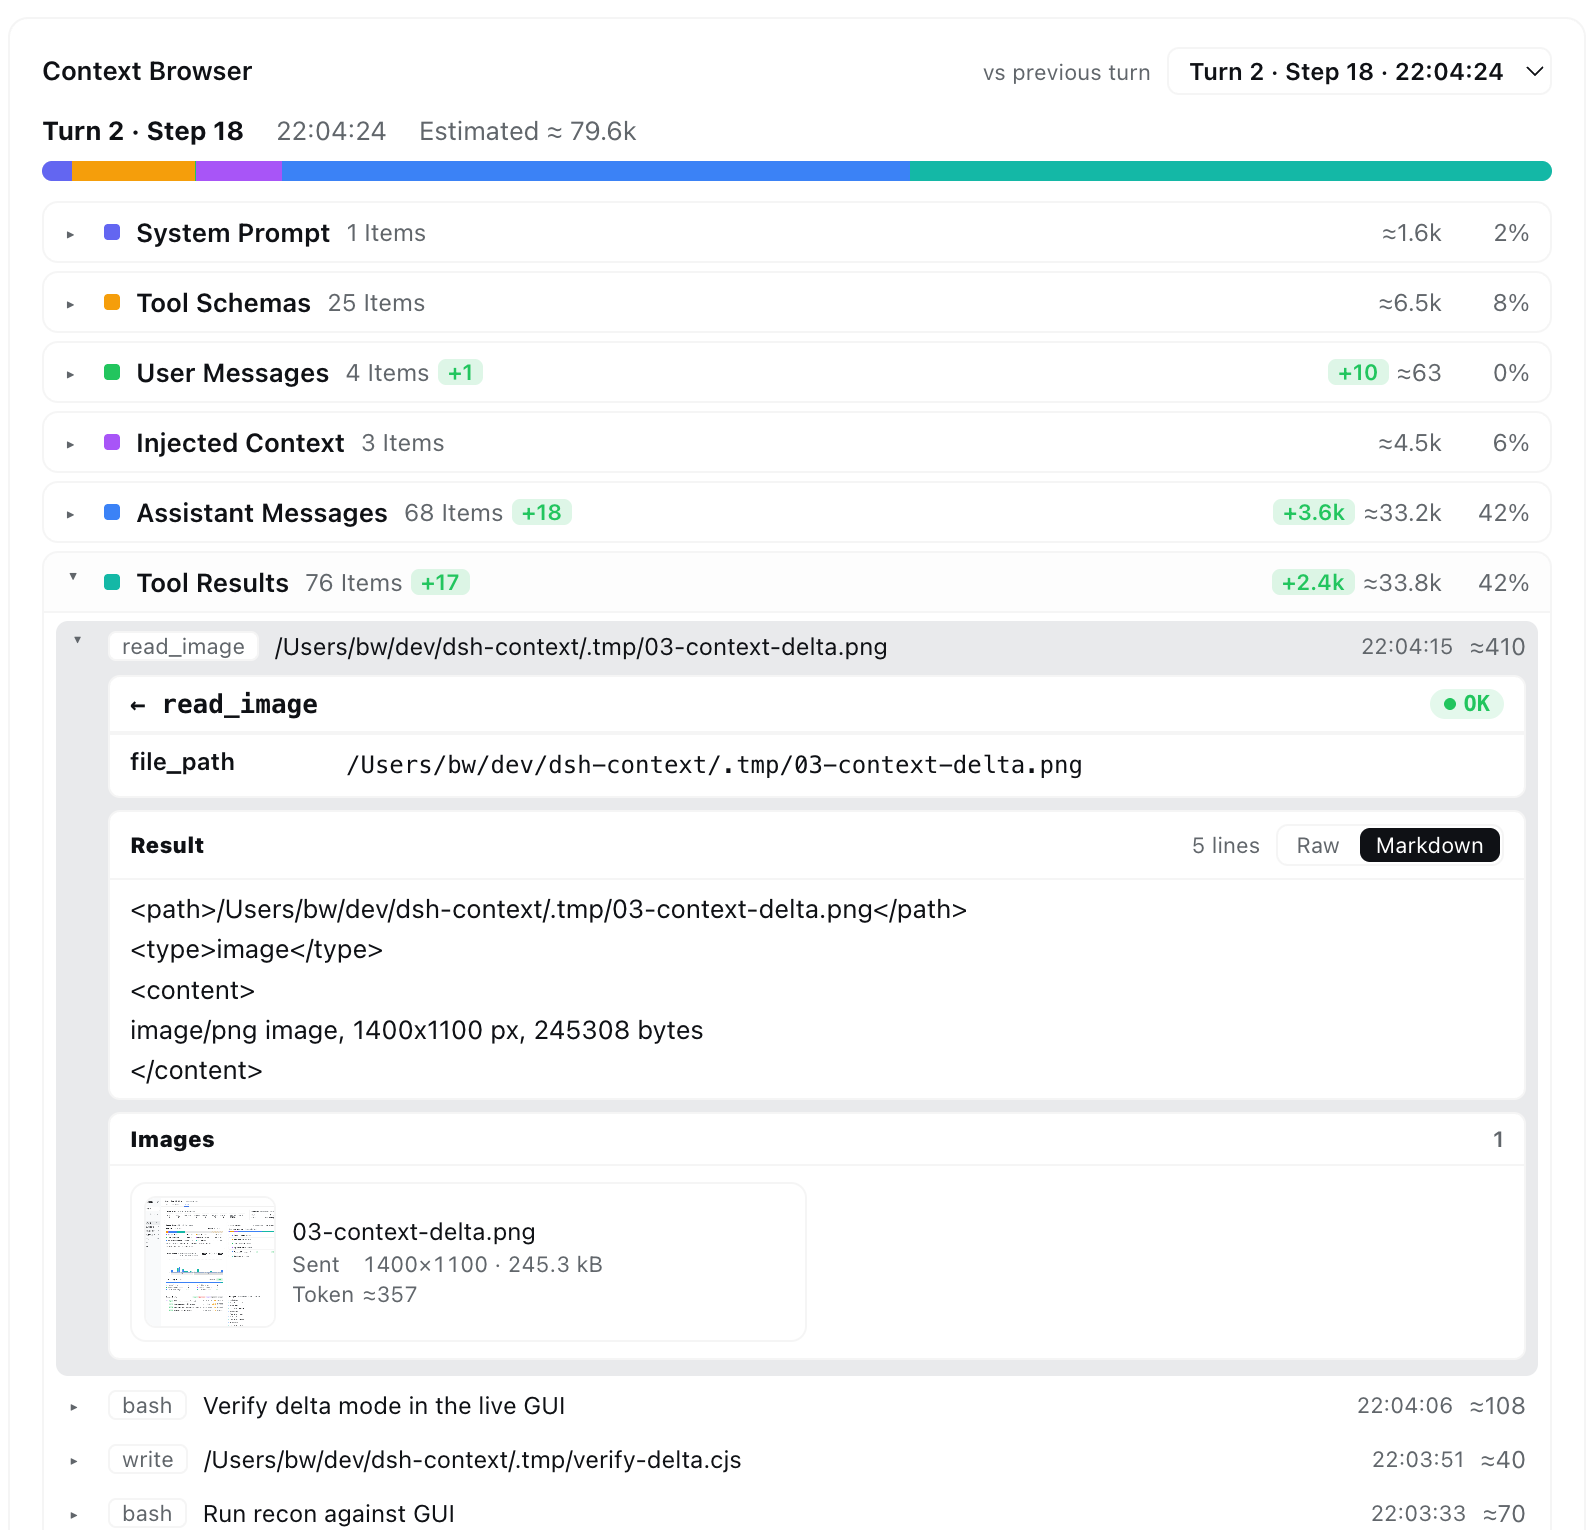
- Diff against the previous turn — switch the picker to vs previous turn and every category gets signed delta badges (
+Nitems,+Nktokens), so one glance tells you what the conversation added since the end of the last turn.
Tool results open into the full call and response: the tool's name and arguments with its OK/error status on top, the result body with its line count and a Raw / Markdown display toggle, and any image payload (e.g. read_image output) rendered as a thumbnail card with its name, dimensions, stored size, and estimated token cost — instead of a flattened blob of text:
🖼 Multimodal — image attachments in full view (DeepSeek Harness 0.1.1+)
Fully adapted to DeepSeek Harness 0.1.1's multimodal pipeline and the vision capability of DeepSeek-V4-Flash-Vision-Exp. A user message carrying images expands into a card layout — prose in the text card (with the usual raw/Markdown toggle), each image attachment as a thumbnail card in an equal-width two-column grid with its name, normalized dimensions (plus the pre-normalization size when 0.1.1's image pipeline downscaled it), stored size, and estimated token cost — priced by DeepSeek's official image-size→token conversion (the docs' image token calculator; 117–384 tokens per image under the provider's per-image cap), the same estimate the message/token breakdowns carry — and anything unrecognized as raw content:
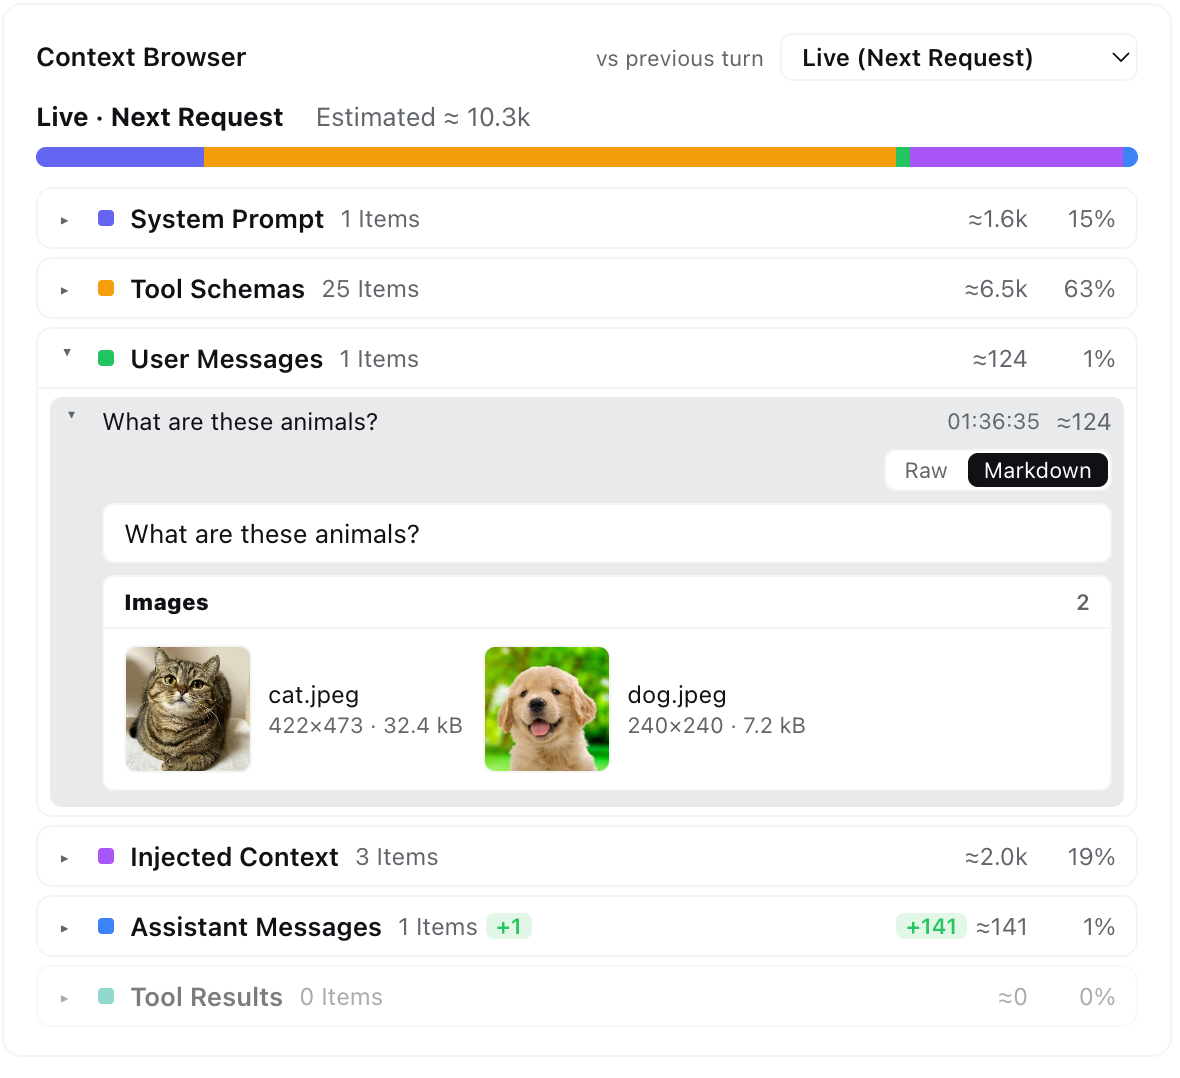
Images load through the harness's own session-authorized loader — the same one the chat history uses — and degrade to metadata-only cards when it is unavailable. Image blocks in assistant messages and tool results (e.g. read_image output) now render too, instead of being silently dropped.
Like it?
If dsh-context helped you understand what your agent is carrying around, a ⭐ on GitHub is much appreciated — and issues/PRs are welcome!
License
安装
装一次目录插件,之后本站所有插件都能让 DeepSeek Harness 自动找、自动装:
dsh plugin add dshbase-catalog然后对 agent 说「帮我装 dsh-context」,它会在目录里找到并自动安装。文档:dshbase-catalog · 已验证场景包。
Web profile:
dsh plugin --profile web add dsh-contextHeadless(CLI)profile:
dsh plugin --profile headless add dsh-context包信息
npm:dsh-context · 版本 — · 实测环境 dsh 0.1.0-rc.6
实测报告
端到端验证通过:dsh 0.1.0-rc.6 上 L1 安装 + L2 加载 + L3 运行问答。
使用场景
给 agent 一套记忆、知识库或检索层,让它不再跨会话丢上下文。
适合谁
跑长项目、想让 agent 记住决策、文档和偏好而不用每次重讲的人。
二次开发建议
记忆/检索后端是缝——插新存储、调蒸馏策略,或加引用与审计轨迹。
- 越权访问 (medium)
分享徽章
把这枚徽章粘进 README——它会链回本页,实测状态变化时自动更新:

[](https://dshbase.com/zh/plugins/dsh-context/)<a href="https://dshbase.com/zh/plugins/dsh-context/"><img src="https://dshbase.com/badges/dsh-context.svg" alt="dshbase 实测可装"></a>